
The VanEck Vectors Rare Earth/Strategic Metals ETF (REMX) is likely to get some media attention Wednesday with China hinting about an export ban. If you think this might come up on Jeopardy tonight, the minerals in question include one of a set of 17 chemical elements in the periodic table, specifically the 15 lanthanides, as well as scandium and yttrium. (Don’t ask me to pronounce any of them.) Now you know more than most people, but let’s check out the charts of this physical ETF that is involved in this space.
In this daily bar chart of REMX, below, we can see a big decline in the price of this ETF from June to late December, with prices getting cut in half. There is a recovery rally in January to April, followed by a retest of the December low this month. In recent days, the trading volume of REMX has surged sharply and prices have moved up to test the underside of the flattening 50-day moving average line. The On-Balance-Volume (OBV) line has responded on the upside and the Moving Average Convergence Divergence (MACD) oscillator has turned up for a cover-shorts buy signal.
In this weekly bar chart of REMX, below, we can see some big swings in prices — up and down. Prices are currently below the declining 40-week moving average line. Volume is strong, the weekly OBV line has spiked up and the MACD oscillator is moving up towards the zero line.
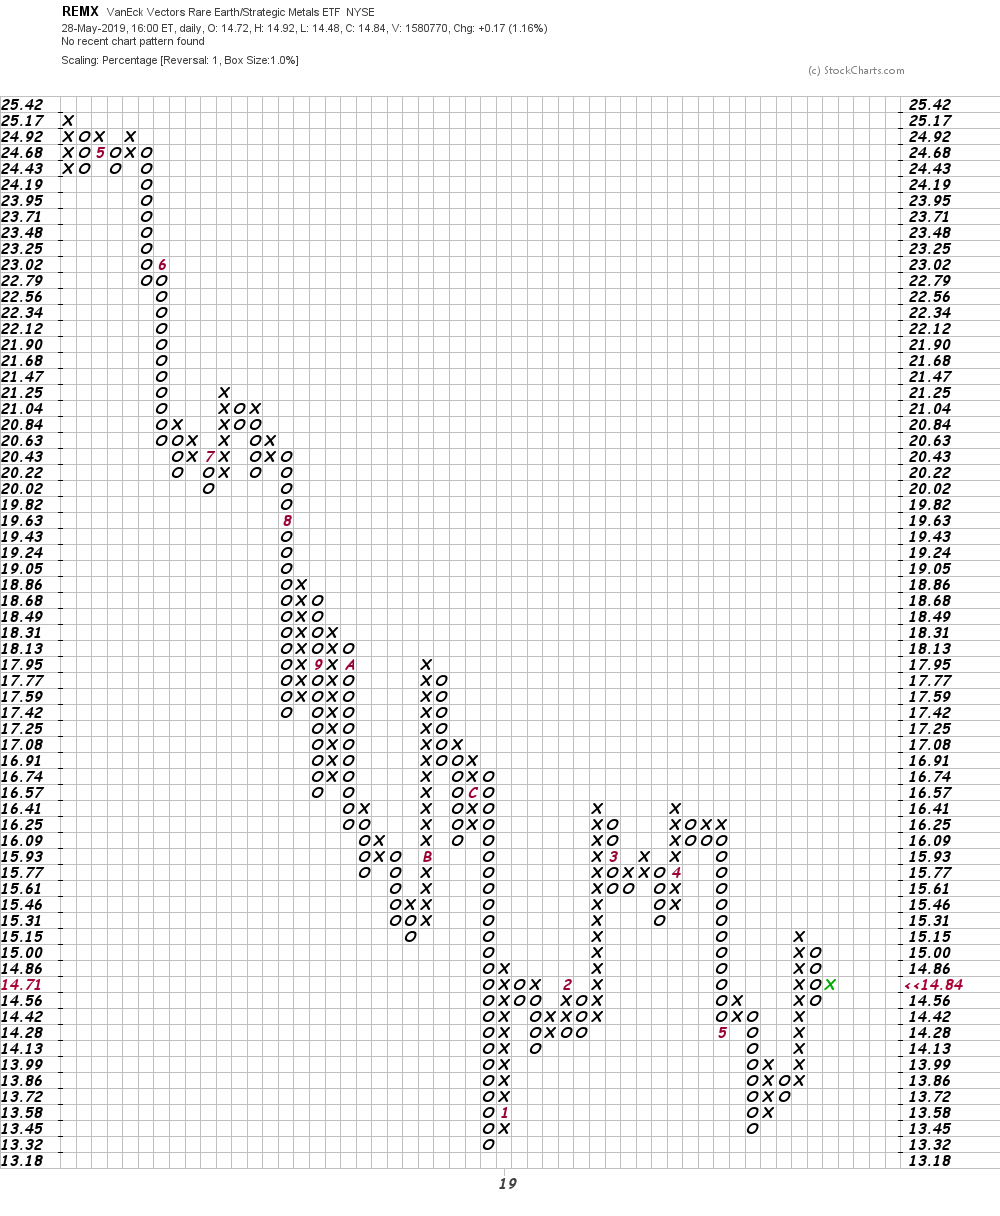
In this Point and Figure chart of REMX, below, we can see a potential double-bottom pattern. A trade at $15.31 will be positive and the big breakout point is a trade at $16.57.
Bottom-line strategy: This was a very short and simple look at REMX. Do your own research and investigate if you want to make an investment.