Cellular functions are dictated by the intricate motion of proteins in membranes that span across a scale of nanometers to micrometers, within a time-frame of microseconds to minutes. However, this rich parameter of space is inaccessible using fluorescence microscopy, although it is within reach of interferometric scattering (iSCAT) particle tracking. The new iSCAT technique is, however, highly sensitive to single and unlabelled proteins, thereby causing non-specific background staining as a substantial challenge during cellular imaging.
In a recent study, Richard W. Taylor and colleagues at the interdisciplinary departments of Physics and Biology in Germany developed a new image processing approach to overcome this difficulty. They used the method to track the transmembrane epidermal growth factor receptor (EGFR) with nanometer scale precision in three dimensions (3-D). The technique allowed imaging across microseconds to minutes. The scientists provided examples of nanoscale motion and confinement using the method to image ubiquitous processes such as diffusion in plasma membranes, transport in filopodia and rotational motion during endocytosis. The results are now published in Nature Photonics.
While steady progress in fluorescence microscopy has allowed scientists to monitor cellular events at the nanometer scale, a great deal still remains to be accomplished with advanced imaging systems. The challenges of fluorescence microscopy occurred due to the finite emission rate of a fluorescent source (dye molecule or semiconductor quantum dot), where too few photon emissions during a very small time-frame prevented effective or prolonged imaging. The central difficulty of scattering-based microscopy is relative to the nanoscopic probe, which competes against the background noise and a low signal-to-noise ratio (SNR); limiting the potential of imaging to only a few nanometers in high speed tracking experiments.
In the present work, Taylor et al. used interferometric scattering (iSCAT) microscopy to track protein in live cell membranes. The method could visualize probe-cell interactions to understand the dynamics between diffusion and local topology. During the experiments, the scientists used gold nanoparticles (GNPs) to label epidermal growth factor receptors (EGFRs) in HeLa cells. The EGFRs are type I transmembrane proteins that can sense and respond to extracellular signals, whose aberrant signaling is linked to a variety of disease. Taylor et al. showed the GNP-labelled protein as a ‘nano-rover’ that mapped the nano-topology of cellular features such as membrane terrains, filopodia and clathrin structures. They provided examples of subdiffusion and nanoscopic confinement motion of a protein in 3-D at high temporal resolution and long time-points.
In the experiments, Taylor et al. introduced the epidermal growth factor-gold nanoparticle (EGF-GNP) probes to the sample chamber of the microscope using a micropipette to label the EGFRs (epidermal growth factor receptors) on HeLa cells and verified that the probes stimulated the EGFRs. Previous studies had already indicated that the probe size could influence rates of lipid diffusion in synthetic membranes, although they did not affect the mode of diffusion. Additionally, in live cells, molecular crowding was negligible for particles equal to or smaller than 50 nm.
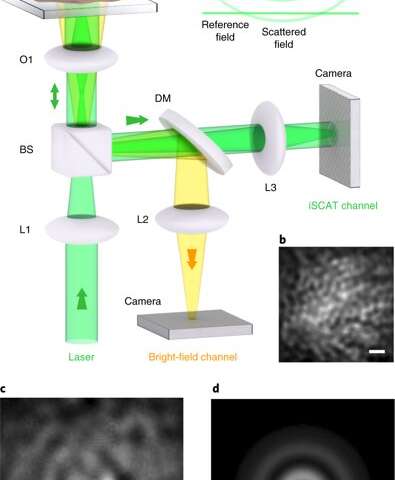
Taylor et al. verified these two concrete cases in the present work by comparing GNPs of varying diameters at 48 nm and 20 nm. The scientists then conducted fluorescent and biochemical studies to suggest that the EGF-coated GNPs activated EGFR signaling, much like the freely available EGFs, indicating that the label did not hinder biological functions. To overcome background noise related to molecular imaging the scientists implemented a new algorithm, which extracted the full iSCAT-point spread function (iSCAT-PSF) directly from each frame for clarity. Since existing techniques are unable to visualize features at high spatial and temporal resolution, many details on intracellular activity remain a matter of debate. In response, the new method by Taylor et al. offered a wealth of dynamic heterogeneities in 3-D to shed light on intracellular protein motion.
The scientists first quantitatively studied subdiffusion in the plasma membrane by considering a 2-D example of the EGFR journey on the membrane of a living HeLa cell. For this, they computed the mean square displacement (MSD) for the whole trajectory of motion. Taylor et al. did not need to make assumptions on the nature of diffusion or its geographic landscape during the computation. They gauged the occurrence of biological diffractive barriers and confinements by observing the degree of directional correlation between two vectorial steps across a time span.
The scientists then assessed the popularity of each trajectory pixel in space by introducing an accumulated temporal occupancy map (ATOM). In this technique, they divided the lateral plane of the trajectory into nanometer-sized bins and counted the occurrence of the particle in each bin. The results indicated the arrangement of nanostructures in loops and whirls within a minimal lifetime of 250 nanoseconds (5000 frames) to potentially portray a pre-endocytic step. In total, the simulated observations showed how protein diffusion was affected by the substructure of the cell.
The iSCAT microscopy technique allowed scientists to record effects for a very long period of time, which they used together with 3-D imaging capabilities to follow EGFRs on a filopodium. The filopodia are biologically rod-like cellular protrusions containing bundles of actin filaments of up to 100 to 300 nm in diameter and 100 µm in length. The nanostructures can sense mechanical stimuli for chemoattraction or repulsion in the cellular microenvironment while providing sites for cell attachment. Ligand binding and EFGR activation on filopodia occurred at low concentrations of EGF, followed by its association with actin filaments and retrograde transport of EFGR to the cell body.
The scientists thus gained insight on the nanoscopic details of diffusion along the filopodium and recorded the data across 13 minutes. They analyzed the 3-D trajectory to create the filopodium topography using gold nanoparticles as a ‘nano rover’ and mapped the surface topology of cellular structures for deeper examination. They plotted the trajectory ATOM (accumulated temporal occupancy map) and found that the 3-D representation was consistent with the biological step of pre-endocytic membrane invagination.
High-speed microscopy techniques such as iSCAT are necessary to obtain high-resolution temporal information and prevent blurring effects during nanoparticle localization-based imaging. The scientists demonstrated this feature by recording confined diffusion at 30,000 fps (frames per second) with 48 nm and 20 nm GNPs. They followed the experiments with ultra-high-speed 3-D tracking of proteins at 66,000 fps using a short exposure time of 10 µs within a time duration of 3.5 seconds. Fast iSCAT microscopy imaging provided further evidence to reveal the intricate features of endocytic events relative to clathrin-mediated endocytosis in HeLa cells when simulated by low concentrations of EGF.
In this way, Taylor et al. noted that the new technique could faithfully record nano-topographical information. The results matched the observations recorded with transmission electron microscopy (TEM) without significant differences on probe size reduction from 48 nm to 20 nm, while providing new insights. The new insights included details of subdiffusion, nanoscopic confinement, 3-D contours of filopodia and clathrin structures at the nanoscale. The scientists intend to combine iSCAT with in situ super-resolution fluorescence microscopy to understand the trajectories of proteins, viruses and other nanoscopic biological entities. Taylor et al. aim to advance the methods of image analysis to track GNPs smaller than 20 nm in the future and believe the new technology and additional optimization will allow them to specifically understand the life cycle of viruses without using an external label for tracking.