SPDR Gold Trust (NYSEARCA:GLD)
The Gold ETF ($121.06 on Dec. 28) is down 2.1% year to date and is 6.5% below its 2018 high of $129.51 set on Jan. 25. The weekly chart is positive but overbought with the ETF above its five-week modified moving average at $117.55 and trending above its 200-week simple moving average or “reversion to the mean” at $117.59. The 12x3x3 weekly slow stochastic reading rose to 81.92 last week, up from 78.15 on Dec. 21, and above the overbought threshold of 80.00.
The daily chart shows strength above the 200-day SMA since Dec. 20 and the 50-day and 200-day simple moving averages are converging at $116.61 and $118.68, respectively, and a “golden cross” is likely to be set in January.
Investor Strategy: Buy weakness to the 200-week SMA at $117.59 and reduce holdings on strength to the 2018 high of $129.51 set on Jan. 25.
The Commodity ETF is heavily-weighted to energy by about 60%.
iShares S&P GSCI Commodity-Indexed Trust ETF (NYSEARCA:GSG)

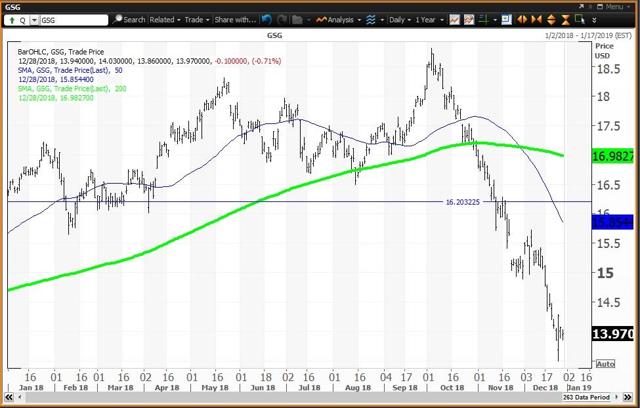
The Commodities ETF ($13.97 on Dec. 28) is down 14.2% year to date with the ETF in bear market territory, down 25.7% from its Oct. 3 high of $18.81. The weekly chart for GSG remains negative but oversold with the ETF below its five-week MMA of $15.26 and below its 200-week SMA or “reversion to the mean” at $16.06, which is below my annual pivot of $16.20. The 12x3x3 weekly slow stochastic reading fell to 8.89 last week, down from 10.91 on Dec. 21, moving further below the oversold threshold of 20.00. This makes commodities “too cheap to ignore”.
Nymex crude oil closed last week at $45.12, down 24.9% year to date and in bear market territory 43.7% below the 2018 high of $76.90 set on Oct. 3. Oil is below its 200-week SMA or “reversion to the mean” at $52.19. Oil set its 2018 low of $43.30 on Dec. 24.
The daily chart shows that GSG formed a “death cross” on Nov. 29. A “death cross” occurs when the 50-day SMA falls below its 200-day SMA, indicating that lower prices would follow. This led the ETF to its Dec. 26 low of $13.50.
Investor Strategy: Buy weakness to my weekly value level of $13.20 and reduce holdings on strength to the 200-week simple moving average at $16.06.
The US Dollar ETF is a basket of currencies that includes the dollar vs. euro, Japanese yen, British pound, Canadian dollar, Swedish krona and Swiss franc.
PowerShares DB US Dollar Index Bullish ETF (NYSEARCA:UUP)
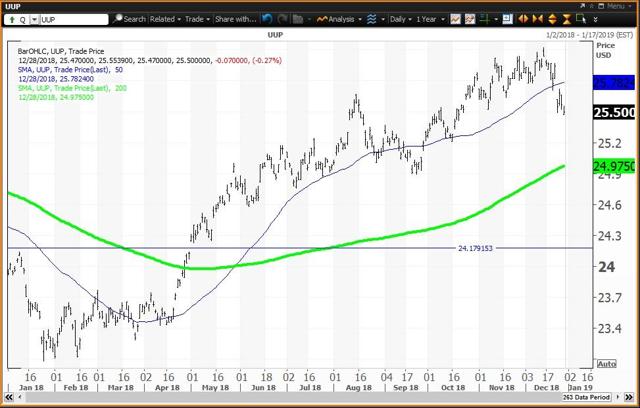
The Dollar ETF ($25.50 on Dec. 28) is up 6.1% year to date and set its 2018 high of $26.12 on Dec. 14. The weekly chart has been downgraded to negative with the ETF below its five-week MMA of $25.74 and above its 200-week SMA or “reversion to the mean” of $25.02. The ETF has been rising with its 200-week SMA since the week of July 28, 2017. The 12x3x3 weekly slow stochastic reading declined to 78.86 last week, down from 84.03 Dec. 21, falling below the overbought threshold of 80.00.
The daily chart shows that UUP gapped below its 50-day SMA at $25.78 last week, which indicates weakness to the 200-day SMA now at $24.98. My annual value level is $24.18, and this ETF has been above this key level since May 1.
Investor Strategy: Buy weakness to the 200-week simple moving average at $25.02 and reduce holdings on strength to the 50-day SMA at $25.78.


