Battery Metals
Uranium developer Denison options Saskatchewan lithium brine project
Uranium-focused Denison Mines (TSX: DML; NYSE: DNN) and lithium explorer Grounded Lithium (TSXV: GRD; US-OTC: GRDAF) have signed a deal that bets on low-cost extraction methods in Saskatchewan.
The agreement gives Denison the option to earn up to a 75% interest in Grounded’s Kindersley lithium brine project in western Saskatchewan, the companies said in a joint news release on Tuesday. Denison, focused on uranium further north in the Athabasca Basin, will pay up to C$15.1 million for the interest, in cash payments of up to C$3.1 million. It will also fund project costs of up to C$12 million through an earn-in option.
Grounded Lithium shares were up 33% at C10¢ apiece at mid-day Tuesday in Toronto on the option deal, valuing the company at C$7.6 million ($5.63m). Its shares have traded between C7¢ and C50¢ over the past year.
The cash is expected to offer more than enough funding for a field pilot at the Kindersley lithium project (KLP) that both companies plan to advance. Kindersley, located just north of the namesake town near the Alberta border, sits on top of the Leduc/Duperow formations that underlie the Prairie provinces.
“This is very significant for us in terms of helping us unlock the value of our project,” Grounded CEO Gregg Smith told The Northern Miner in an interview. “Denison is also doing first-of-a-kind uranium mining in Saskatchewan, where they’re doing in-situ extraction of uranium. That really reduces the cost. It’s a very innovative approach to it and it will be first of its kind in Canada. It kind of goes to the heart of what their company is.”
Denison CEO David Cates said in a statement the company views lithium as a complementary mineral to Denison’s core uranium business, with both identified as critical minerals for the clean energy transition.
“Combining our deep local technical capabilities with the Grounded team’s experience on KLP has the potential to create an incredible environment to incubate the KLP to emerge as a premier lithium project in a top mining jurisdiction,” he said.
The investment from Denison comes as momentum builds for lithium brine projects on the Prairies, despite a drop in lithium prices, with Grounded having released a strong preliminary economic assessment (PEA) for Kindersley last July that showed it could produce 11,000 tonnes of lithium hydroxide over a 20-year life. EMP Metals (CSE: EMPS; US-OTC: EMPPF) is also advancing a lithium brine project in Saskatchewan, along with E3 Lithium (TSXV: ETL; US-OTC: EEMMF) and Volt Lithium (TSXV: VLT), in neighbouring Alberta.
Low-cost solution extraction
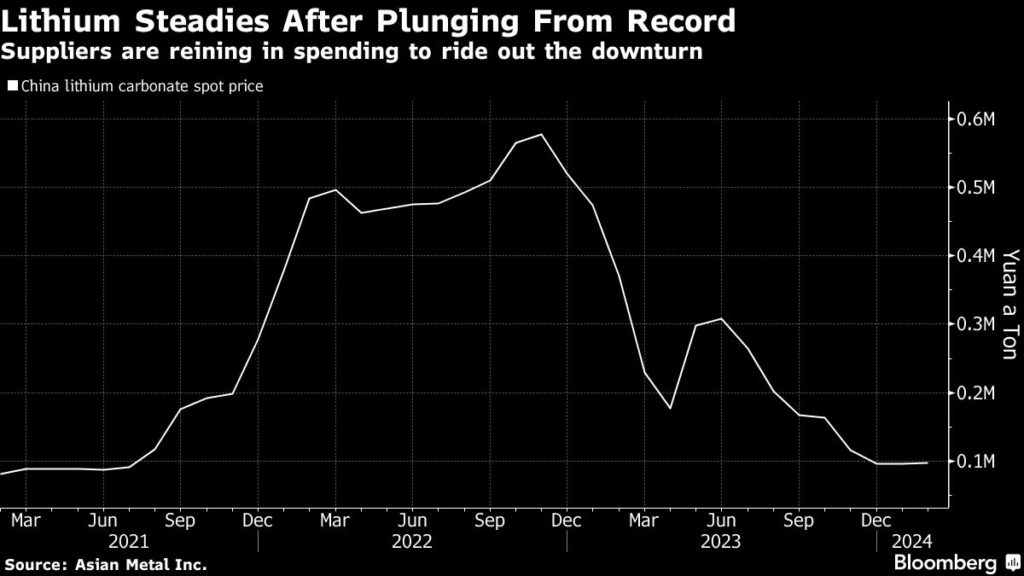
Denison’s investment in lithium comes as prices for the battery metal have tanked, while prices of its principal commodity, have risen to highs not seen since 2007. On Monday, the spot price hit $103 per lb. The price increase is being driven by rising demand for nuclear energy projects and limited supply.
Denison is also emerging as a potential pioneer of in-situ recovery (ISR) mining in the Athabasca Basin, after a final set of field tests last November showed it could be successfully deployed on a commercial scale at the Wheeler River project. ISR involves pumping a solution underground, where it separates uranium from the ore and is later pumped back to the surface. It costs less than underground mining, doesn’t require digging pits and has a smaller environmental footprint.
In that test, Denison recovered 14,400 lb. of uranium oxide (U3O8) in solution in the leaching and neutralization phases, and recovered over 99.99% of the contained uranium in the solution management phase. Previous tests going back to 2019 also returned positive results, including one in 2022 that Denison called ‘history in the making.’
While both processes involve pumping a solution to the surface, Grounded uses direct lithium extraction to draw lithium-containing brine from old oil wells underground. The extracted solution is purified in a surface plant to bring out the high-grade lithium carbonate and lithium hydroxide.
Canaccord Genuity analyst Katie Lachapelle told The Northern Miner that if Denison successfully obtains its permits to mine, Wheeler River could open up new possibilities for uranium projects.
“It’ll unlock a lot of 20, 50, 60 million lb. deposits in Canada that otherwise wouldn’t have been considered super economic, or that you wouldn’t want to put the capital into building a shaft. So, I think it’s a game changer,” she said.
Kindersley
Kindersley’s first phase has an after-tax net present value (at 8% discount) of $1 billion, an internal rate of return of 48.5% and at initial capital costs of $335 million, with a payback period of 3.7 years.
KLP hosts 586,044 measured tonnes of lithium hydroxide, 525,651 indicated tonnes and 3.6 million inferred tonnes, all grading at 74 mg of lithium per litre.
The new deal entails Denison increasing its cash payments to Grounded from C$800,000 in the first phase of Kindersley to C$3.1 million in the third, in line with an increase in Denison’s interest from 30% to 75%. Expenditures for the project will generally be wholly funded by Denison.
The agreement will last until Denison opts to acquire its working interest and convert it to a formal joint venture, or until either June 30, 2028 or another date agreed by the companies.
Denison has also bought a 5% gross overriding royalty on KLP for C$800,000, which would drop to 2% after all approvals for the project are received, and removed entirely 15 months after the earn-in agreement closes.
The two companies have established an area of mutual interest for any lands acquired within 10 km of any properties contained within Kindersley that are prospective for lithium.
“Their investment is helping us de-risk by putting in place the pilot,” Smith said. “That allows us to fine tune our engineering studies and produce the feasibility so then we can start to march forward towards commerciality.”
Denison shares were down 2.1% to C$2.74, giving it a market capitalization of C$2.4 billion ($1.7bn). Its shares traded between C$1.28 and C$2.82 over a 52-week window.
Gold-inflation disconnect
Gold’s vexing disconnect from reported inflation took center stage again this week. The latest US inflation read came in hotter than expected, yet gold didn’t surge despite being the classic inflation hedge. This strange incongruity has festered for a few years now thanks to the Fed’s incessant manipulations of rates and market psychology. But the efficacy of that is waning with this central bank’s monster rate-hike cycle over.
Early yesterday the US Bureau of Labor Statistics released its latest Consumer Price Index report, the primary inflation gauge traders follow. December’s headline-CPI print climbed 0.3% month-on-month and 3.4% year-over-year, 0.1% and 0.2% hotter than expectations. The core CPI excluding food and energy rose 0.3% MoM and 3.9% YoY, in-line and 0.1% hotter. Rising shelter costs accounted for 2/3rds of that.
With three of the CPI’s four key metrics showing inflation worsening again, gold should’ve caught a bid. For centuries if not millennia, investors have upped their gold portfolio allocations in inflationary times. General price increases are fueled by fiat-money-supply growth, which far outpaces gold mined-supply growth. That only runs about 1% annually, naturally constrained by the many challenges of mining gold.
Unfortunately this odd gold-inflation disconnect is nothing new. Gold has been rallying on cooler inflation and selling off on hotter inflation for several years now! In mid-July for example, gold surged 1.3% the day the latest headline CPI printed just 0.1% cooler in both monthly and annual terms. Earlier in mid-September 2022, gold plunged 1.3% the day that latest headline CPI came in hotter by 0.2% MoM and 0.3% YoY.
Gold reacting to reported-inflation surprises counter to long precedent is illogical and upside-down. But this stunning gold-inflation disconnect goes way beyond inflation-data reactions. This chart superimposes gold’s price action in recent years over the annual headline-CPI changes. That popular inflation gauge experienced its first super-spike since the 1970s in recent years! Inflation has been running extremely hot.
This latest inflation super-spike was born in May 2020, when the CPI troughed rising a mere 0.1% YoY! That was an extraordinary anomaly resulting from the widespread pandemic lockdowns when COVID-19 first reared its ugly head. Knowing little about this novel virus then, people were really scared and heavily curtailed their economic activity. The resulting plunging consumer demand forced general prices lower.
Gold averaged $1,719 that month when the seriously-shuttered US economy was threatening to roll over into a deflationary depression. With the US stock markets plummeting over a third in just over one month, top Fed officials panicked! So they redlined their monetary printing presses to start injecting what would grow into trillions of new dollars into the economy, monstrously ballooning the Fed’s balance sheet after.
That’s effectively the monetary base underlying the US dollar supply. Over 25.5 months starting just before that pandemic-lockdown stock panic, the Fed’s balance sheet skyrocketed an absurd 115.6%! Top Fed officials conjured up $4,807b of new dollars out of thin air, literally more than doubling the entire US money supply in just over a couple years! Vastly more dollars out there guaranteed big inflation was coming.
After an exhaustive study of US monetary history, the legendary American economist Milton Friedman declared in 1963 that “Inflation is always and everywhere a monetary phenomenon.” The endless goods and services comprising the vast US economy can’t be grown fast. So when monetary growth rates well exceed economic growth, relatively-more dollars chase and bid up prices of relatively-less goods and services.
The Fed’s dumbfounding monetary deluge really started appearing in the CPI in April 2001, when it rose faster than 4.0% YoY for the first time in 12.6 years. From there reported inflation kept on accelerating even more dramatically. The headline CPI finally peaked at scorching 9.1% YoY gains in June 2022! That proved the hottest CPI read since November 1981, late in the last inflation super-spike’s lifespan!
That month gold averaged $1,837. So during the worst inflation since the 1970s, monthly-average gold prices merely rallied 6.9%! Some argued gold’s classic role as the leading inflation hedge had ended forever. Indeed gold’s performance in this latest inflation super-spike was dreadful compared to 1970s precedent. That decade actually suffered two distinct inflation super-spikes as measured by the same CPI.
The first ran 30 months into December 1974, when the CPI’s YoY increase surged from 2.7% to 12.3%. Monthly-average gold prices soared 196.6% during that span! That decade’s second inflation super-spike was much larger and longer. It was born at a 4.9%-YoY CPI increase, and crested at a soul-crushing 14.8% in March 1980. During those 40 months, monthly-average gold prices skyrocketed an amazing 322.4%!
So gold meandering slightly higher through this latest inflation super-spike’s 25 months defied pretty much all historical precedent. With inflation raging out of control thanks to extreme Fed money printing, gold prices absolutely should’ve reflected that. Yet they didn’t, for the same reasons gold sold off after this week’s hotter CPI. Fed manipulations of interest rates and market psychology greatly distorted everything.
With the headline CPI surging over 7.0% YoY in December 2021, top Fed officials were very worried about the inflation monster they had unleashed. So they finally started hiking rates off zero in March 2022. That rate-hike cycle would ultimately grow utterly gargantuan, fully 11 hikes upping the federal-funds rate by an extreme 525 basis points in just 16.3 months! That included four 75bp monster hikes in a row!
With the Fed so hellbent on hiking fast, traders hung on every word from top Fed officials. And every important economic-data release was viewed through a how-will-this-influence-the-Fed lens. That wasn’t just CPI inflation, but wholesale PPI inflation, Fed officials’ favorite PCE inflation gauge, monthly US jobs, and other key data. All recent years’ reports were immediately weighed as hawkish or dovish for the Fed.
Hotter-than-expected inflation data or stronger jobs growth increased the odds the Fed would keep aggressively hiking. Cooler inflation or weakening jobs gave the Fed cover to slow its blistering rate hikes. This what-will-the-Fed-do dynamic hanging on every major economic-data report directly drove gold’s illogical disconnect from inflation. Fed watching trumped everything else in the entire financial markets!
Top Fed officials certainly knew this, but enjoying their fame kept on meddling anyway. I wasn’t yet old enough to study markets in the 1970s, but my understanding is the Fed was far more subtle then. It did hike rates, but quietly without fanfare. The FOMC didn’t release statements detailing each meeting’s monetary-policy decisions, Fed officials didn’t predict future rate trajectories, and the Fed chair didn’t hold pressers!
During those last inflation super-spikes, Fed officials weren’t financial celebrities like today. They wisely didn’t want to impair efficient market functioning, so they did their work in the background. Apparently back then changes in the federal-funds rate weren’t even disclosed! Traders had to infer them based on market action. So the entire financial markets and gold specifically weren’t slaved to Fed machinations then.
While Fed officials’ flamboyant meddling is the main driver of gold’s recent disconnect from inflation, the transmission mechanism to prices is gold-futures trading. It allows extreme leverage far beyond the 2x legal limit in stock markets. Each gold-futures contract controls 100 ounces of gold, worth $202,390 at mid-week prices. Yet speculators are only required to hold cash margins of $8,300 for each contract traded.
That enables crazy maximum leverage of 24.4x, exceedingly risky! At 24.4x a mere 4.1% gold move against positions would wipe out 100% of capital risked! That forces these hyper-leveraged traders to have ultra-myopic short-term focuses. They can’t afford to be wrong for long, so they can only care what gold is likely to do in coming hours or days. They watch the US dollar’s fortunes for their primary trading cues.
Fed rate decisions certainly affect the US dollar. Rate hikes increase yields in dollar-denominated bonds led by US Treasuries. That makes them more attractive to foreign traders, fueling dollar buying. So Fed-hawkish economic data is legitimately dollar-bullish. If hotter-than-expected inflation increases odds for either more Fed rate hikes or holding the federal-funds rate higher for longer, the US dollar is bid higher.
That certainly happened in spades in recent years, especially in mid-2022 during the height of the Fed’s record rate-hike cycle. The benchmark US Dollar Index skyrocketed a staggering 16.7% higher in just 6.0 months as the Fed unleashed four monster 75bp hikes in a row! That catapulted the USDX to an extreme 20.4-year secular high, explaining gold’s 20.9% plunge then. That unsustainable anomaly soon reversed hard.
As the exceedingly-overbought and wildly-crowded long-dollar trade rolled over into early 2023, gold mean reverted sharply higher regaining all its lost ground. But that Fed-rate-hike-driven gold plunge due to gold-futures speculators dumping massive contracts on a soaring US dollar is the main reason gold recently disconnected from inflation. This is a temporary illusion fueled by Fed-driven gold-futures trading.
Ironically Fed-rate-hike cycles are actually bullish for gold historically. Leading into the Fed’s maiden hike in early 2022, I did a comprehensive study of gold’s performances during all hiking cycles of the modern monetary era since 1971. There were twelve of them before this latest record one. Gold averaged strong 29.2% gains across their exact spans! Gold tended to fare better when those rate hikes were more gradual.
This latest monster hiking cycle was anything but, proving the most violent in the Fed’s entire history. Yet gold still edged up 3.0% through its exact duration, weathering 11 hikes for 525bp! Gold’s gains would’ve been far better had it not gotten crushed by that colossal dollar rally. The gold-futures speculators are dead-wrong in assuming higher rates are bearish for gold, blinded by their extreme-leverage-induced myopia.
Because of that extreme leverage, gold-futures traders wield outsized influence over gold prices. A dollar deployed in gold futures at 24x leverage has 24x the price impact on gold as a dollar invested outright! And there is one final related piece to this gold-inflation-disconnect puzzle. Gold-futures specs can only dominate gold prices when investors are away, as their vast pools of capital dwarf specs’ far-smaller ones.
Any way you slice it, gold investment demand has been dismal in recent years. From gold’s pandemic-stock-panic low in mid-March 2020 to its latest record close in late December 2023, it has powered 41.1% higher. Yet during that same span, the combined holdings of the mighty world-dominant GLD and IAU gold ETFs have slumped 1.9%. They are the best daily high-resolution proxy for global gold investment demand.
From gold’s monster-dollar-rally low in late September 2022 to late December 2023, it surged up 28.0%. Yet investors didn’t care, as GLD+IAU holdings actually fell 10.5% in that span! Investors have been missing in action in gold for years, allowing hyper-leveraged gold-futures speculators to run amok in bullying around gold prices. Investors haven’t yet returned because gold’s price action hasn’t been good enough.
Investors love chasing winners, and flood into gold during major uplegs to ride its upside momentum. Their big buying accelerates gold uplegs, easily overpowering whatever the gold-futures specs are doing. But investors need plenty of convincing before buying back in, gold has to first rally high enough for long enough to generate sufficient excitement. That hasn’t yet happened, so gold’s inflation disconnect has lingered.
Investors are still apathetic on gold because its gold-futures-driven price action in recent years hasn’t been bullish enough. Gold’s futures price is unfortunately its world reference one, which investors see. So gold psychology has been artificially suppressed in recent years by hyper-leveraged gold-futures trading fading the US dollar’s fortunes on Fed officials’ flamboyant meddling! Is gold doomed to this lot forever?
No way, markets are perpetually cyclical. Extremes of price and sentiment never last for long before mean reverting and overshooting the other way. And that’s coming this year, accelerating gold’s record breakout upleg in 2024. This gold-inflation disconnect’s days are numbered, and way-higher gold prices are coming on the other side. The catalyst will be the Fed shifting from a higher-rates-for-longer bias to cutting.
Top Fed officials last hiked their federal-funds rate way back in late July, and have increasingly signaled since they are done hiking. That was especially apparent at the last FOMC meeting in mid-December. There the FOMC statement added a qualifier making further hikes sound less likely, top Fed officials cut their year-end-2024 FFR projections by 50bp, and the Fed chair himself said rate-cut timing was discussed!
A new Fed-rate-cut cycle will be born this year, possibly as soon as mid-March but almost certainly by summer. With the Fed starting to cut rates and increasingly expected to do more, all the gold-stunting dynamics of recent years will reverse. The still-high US dollar will sell off on economic data supporting more cuts faster. That will fuel gold-futures buying, pushing gold deeper into nominal-record-high territory.
That will increasingly attract back investors, whose buying to chase gold’s gains will overpower most gold-futures speculators’ selling. This process will unwind gold’s anomalous inflation disconnect, restoring normal inflation-hedge behavior. Prevailing gold prices will ultimately reflect the still-vastly-higher US-dollar supply thanks to the Fed’s extreme money printing in recent years. Rate cuts will affect that too.
In addition to hiking rates aggressively since early 2022, the Fed has been gradually shrinking its balance sheet. Previously-monetized bonds maturing are being slowly rolled off without repurchases, contracting the money supply. Fed officials will have to end this quantitative-tightening bond selling around when they start cutting rates, since they are opposing monetary policies at cross purposes. So QT will soon be done!
Remember the Fed ballooned its balance sheet which is effectively the monetary base by 115.6% in just over a couple years after March 2020’s pandemic-lockdown stock panic. Despite the QT since, the Fed’s balance sheet remains a shocking 84.7% higher in early January 2024! Of the Fed’s crazy $4,807b of money printing, fully $3,522b or nearly three-fourths is still in the economy! Gold needs to normalize to that.
Inflation is simply general price levels rising to reflect expanded money supplies. I don’t know how high the Fed’s balance sheet will be when it kills QT, but let’s assume it is still 2/3rds above February 2020 levels. That means general price levels should stabilize about 2/3rds higher less economic growth in recent years. Gold prices will also reflect that extra money, maybe 2/3rds higher less mined-supply growth.
Since American voters hate inflation which is a punitive stealth tax, the CPI is intentionally lowballed by the US government to understate inflation. According to the CPI, general price levels are only 18.6% higher than February 2020’s! I don’t know about you, but I don’t believe that for a minute. Based on what I’ve experienced running a small business and household, price levels seem at least 50% higher today.
The headline CPI’s 18.6% inflation over the past 3.8 years implies about 4.5% annual price increases. There’s no way they’ve been that small, we’re all experiencing annual inflation rates closer to 10% to 20% since the lockdowns. Real-world examples are legion, inflation is running way hotter than the Biden Administration’s bureaucrats claim. The overall total is closer to 85% Fed-balance-sheet growth than 19% CPI.
But to be conservative, let’s assume the US money supply will stabilize this year around 2/3rds higher than pre-lockdown levels. Gold averaged $1,596 in February 2020 with a far-smaller Fed balance sheet. If gold normalizes proportionally to that being 2/3rds higher, that implies prices heading over $2,650. Even rallying a fraction of that distance would radically improve psychology, bringing investors back in droves!
The biggest beneficiaries of much-higher prevailing gold prices as that inflation disconnect is unwound will be the gold miners’ stocks. The GDX majors soared 134.1% during gold’s last mighty 40.0% upleg in mid-2020 seeing new records fueled by investors flooding back in. Smaller fundamentally-superior mid-tiers and juniors tend to well outperform, and our newsletter trading books are currently full of cheap great ones.
The bottom line is recent years’ strange gold-inflation disconnect is an unsustainable anomaly. Gold has been dominated by hyper-leveraged gold-futures trading, driven by the US dollar’s fortunes. Those have been strong due to aggressively-hawkish Fed meddling in recent years. But with the Fed’s monster rate-hike cycle over and a new cutting one soon coming, this counter-historical dynamic will reverse and unwind.
The still-high US dollar will weaken considerably as the Fed increasingly waxes dovish and rate-cut hype builds. That will spawn leveraged gold-futures buying, pushing gold higher which will start attracting back missing-in-action investors. Their big buying will ultimately help gold normalize relative to inflated money supplies. That portends much-higher gold prices in coming years, catapulting battered gold stocks way higher.
Copper’s Critical Role in Green Energy Transition
In the Autumn of 2023, the International Copper Study Group (ICSG) forecast that the copper market was likely to experience a significant surplus of the metal in 2024 after several companies worldwide ramped up their operations in response to the growing global demand. However, by the end of the year, updated forecasts suggested that copper prices would skyrocket in 2024, as the world faces deficits of the critical metal driven by more ambitious climate pledges from various countries around the globe. So, what can we expect for copper in the coming year?
In October, the ICSG predicted that the copper market would experience a major supply surplus in 2024, following a supply-demand balance last year. Production was expected to exceed usage by 467,000 metric tonnes in 2024, a significant increase from the 297,000 metric tonne surplus predicted for 2024 in April. However, the group made it clear that the forecast was based on the existing global project pipeline for supply and demand, which is rapidly changing as the green transition accelerates worldwide.
This updated forecast reflected a weak Western demand coupled with the strong Chinese copper output. By October, copper usage outside of China was expected to contract by one percent from the 2022 level “mainly impacted by declines in refined usage in EU countries and North America”, according to the ICSG. Meanwhile, China’s copper usage was expected to grow by 4.3 percent in 2023, based on the information the ICSG had available about the Chinese market. The growing demand in China has been driven by its power and electric vehicle sectors, which have remained strong despite a dip in manufacturing levels in 2023.
The ICSG stated, “An expected improvement in manufacturing activity, the ongoing energy transition and the development of new (semi-manufactured product) capacity in various countries should support higher growth in world refined usage in 2024.” Copper is viewed as a critical metal, vital for the construction of electric vehicles, power grids and wind turbines.
However, by the end of 2023, a report from the BMI Fitch Solutions research unit suggested that copper prices were expected to rise dramatically over the next two years owing to mining supply disruptions and higher demand. The report stated that it expects copper prices to rise by more than 75 percent over the next two years, driven by the acceleration of the global green transition. Prices could also be higher as the value of the dollar declines later in the year if the U.S. Federal Reserve cuts rates this year.
This updated prediction reflects several pledges made at the recent COP28 climate summit, where over 60 countries supported a plan to triple the global renewable energy capacity by 2030. Achieving this aim will require huge levels of copper to be produced in the coming years. In fact, higher renewable energy targets could push the global copper demand up by an additional 4.2 million tonnes by 2030. Based on this expectation, copper prices could rise to $15,000 a tonne in 2025, far higher than the previous record peak of $10,730 per tonne record last March.
Goldman Sachs has stated that it predicts a deficit of over half a million tonnes of copper in 2024 due to mining disruptions. In November, production was paused at the Cobre Panamá mine due to a Supreme Court ruling and widespread protests because of environmental concerns. Meanwhile, the copper producer Anglo American stated that it planned to reduce its output in 2024 and 2025 to cut costs. Goldman analysts wrote, “The supply cuts reinforce our view that the copper market is entering a period of much clearer tightening.” The group believes that copper prices could hit $10,000 a tonne by the end of 2024, before rising even higher the following year.
Emerging green energy markets are expected to benefit substantially from the rising demand for critical minerals and metals, including the South American countries Chile and Peru. Rising demand for copper is expected to spur greater investment in mining in the two countries, as well as drive export demand. Chile is home to around 21 percent of the world’s copper reserves. Chile is also experiencing high levels of success in its lithium industry, which is gaining greater international investment as demand rises. It forms part of the lithium triangle, alongside Argentina and Bolivia, which, together, hold more than 75 percent of the world’slithium supply.
Despite a less-than-optimistic forecast for the copper market earlier in 2023, several end-of-year outlooks predict a far higher global demand for copper between now and 2030, driving up copper prices. This rising demand could lead to copper deficits unless governments and private companies invest heavily in mining activities to ensure that the output meets demand in support of an accelerated green transition.
China’s rare earth exports hit 5-year high on demand from EV, high-tech sectors
China’s exports of rare earths in 2023 rose 7.3% from the prior year, customs data showed on Friday, boosted by competitive prices and growing overseas demand from electric vehicle makers and other high-tech sectors.
The world’s largest producer of rare earths shipped 52,307 metric tons of the minerals abroad last year, the highest since 2018, data from the General Administration of Customs showed.
Demand for rare earths picked up in line with the rapid development of new energy vehicles, wind power and inverter air conditioners, analysts said. The minerals are also used widely in lasers, military equipment and consumer electronics.
China has been engaged in an escalating battle over control of critical minerals and last year introduced restrictions on exports of germanium, gallium and some graphite products, which are used in semiconductors and electric vehicle batteries.
That fanned fears that rare earths might be the next target, spurring a rush of buying.
Europe and the United States are trying to wean themselves from dependence on rare earths from China, which accounts for nearly 90% of global refined output.
The increase in demand, however, lagged a rise in supply, weighing on prices for much of last year, although fears of supply disruptions stoked by a mining suspension in Myanmar pushed prices to a 20-month high last September.
China has set its 2023 rare earth mining quota at 255,000 metric tons and the annual smelting and separation quota at 243,850 tons, both up more than 20% from the year before.
The spot price for praseodymium neodymium oxide at the end of last year was down 34% from a year earlier, at 457,500 yuan a ton, data from consultancy Shanghai Metals Market (SMM) showed.
China’s exports of the 17 minerals classified as rare earths fell 18.2% in December from the previous month, to 3,439 tons, the customs data showed. That was down 20% from December 2022.
China’s imports of rare earths last month were up 45% on the year at 16,381 tons, while the 2023 total climbed 44.8% from a year earlier to 175,853 tons.
A huge battery has replaced Hawaii’s last coal plant
Hawaii shut down its last coal plant on September 1, 2022, eliminating 180 megawatts of fossil-fueled baseload power from the grid on Oahu — a crucial step in the state’s first-in-the-nation commitment to cease burning fossil fuels for electricity by 2045.
But the move posed a question that’s becoming increasingly urgent as clean energy surges across the United States: How do you maintain a reliable grid while switching from familiar fossil plants to a portfolio of small and large renewables that run off the vagaries of the weather?
Now Hawaii has an answer: It’s a gigantic battery, unlike the gigantic batteries that have been built before.
The Kapolei Energy Storage system actually began commercial operations before Christmas on the industrial west side of Oahu, according to Plus Power, the Houston-based firm that developed and owns the project. (The company just had the good sense to wait to announce it until journalists and readers had fully returned from winter holidays.)
Now, Kapolei’s 158 Tesla Megapacks are charging and discharging based on signals from utility Hawaiian Electric. The plant’s 185 megawatts of instantaneous discharge capacity match what the old coal plant could inject into the grid, though the batteries react far more quickly, with a 250-millisecond response time. Instead of generating power, they absorb it from the grid, ideally when it’s flush with renewable generation, and deliver that cheap, clean power back in the evening hours when it’s desperately needed.
“It feels incredible to be part of what Hawaii and Hawaiian Electric are doing to get to 100% renewable energy and to play this enabling role to help them get one step closer,” Plus Power Executive Chairman Brandon Keefe told Canary Media.
The construction process had its setbacks, as did the broader effort to replace the coal plant with a roster of large-scale clean energy projects. The Kapolei battery was initially intended to come online before the coal plant retired. Covid disrupted deliveries for the grid battery industry across the board, and Kapolei’s remote location in the middle of the Pacific Ocean didn’t make things easier. By summer 2021, Plus Power was hoping to complete Kapolei by the end of 2022, but it ended up taking another year. Even then, it has joined the grid before several of the other large solar and battery projects slated to replace the coal plant’s production with clean power.
Batteries replace key coal plant functions
Grid batteries operate in a fundamentally different way than coal plants, so Hawaiian Electric and Plus Power crafted a new framework to replace what needed to be replaced. The old coal generator provided three key values to Oahu, Keefe explained: energy (the bulk volume of electricity), capacity (the instantaneous delivery of power on command), and grid services (stabilizing functions for the grid, wonky but vital to keeping the lights on).
The battery directly replaces the latter two: It matches the coal plant’s maximum power output (or “nameplate capacity,” in industry parlance), and it is programmed to deliver the necessary grid services that keep the grid operating in the right parameters. The grid runs within a certain frequency, but events can cause the frequency to stray out of bounds, say if another power plant trips offline or a sudden rush of solar production outstrips consumption. The Kapolei project provides a first line of defense, called “synthetic inertia,” responding to and correcting grid deviations in real time. If the situation continues to deteriorate past a specified threshold, the battery’s fast frequency response kicks in as a second line of defense.
With 565 megawatt-hours of storage, the battery can’t directly replace the coal plant’s energy production, but it works with the island’s bustling solar sector to fill that role. “We’re enabling the grid to add more clean renewable energy to the system to replace the energy from the coal plant,” Keefe said.
Hawaiian Electric’s modeling suggests it can reduce curtailment of renewables by an estimated 69% for the first five years thanks to Kapolei Energy Storage, allowing surplus clean electricity that would otherwise go to waste to get onto the grid.
The utility also requested “black-start capability.” If a disaster, like a cyclone or earthquake, knocks out the grid completely, Hawaiian Electric needs a power source to restart it. The Kapolei batteries are programmed to hold some energy in reserve for that purpose. Plus Power located the project near a substation connected to three other power plants so the battery “can be AAA to jump-start those other plants,” Keefe said.
The combination of all these abilities in one site — capacity, grid services, black start — leads Keefe to call Kapolei “the most advanced battery energy storage facility on the planet.”
Model for a reliable clean-energy grid
The new battery is just the latest dispatch from Hawaii’s long-held spot at the vanguard of the energy transition. This is the state that hit mass rooftop solar adoption first and crafted the first utility-scale solar-battery plant in Kauai (not coincidentally, Plus Power CCO Bob Rudd had a hand in that project during his tenure at Tesla).
But when renewables growth and fossil-plant retirements pass a certain threshold, as they have in Hawaii, simply adding more wind, solar or batteries isn’t sufficient. The clean technologies, which run on digitally controlled inverters, have to start maintaining the grid, not just feeding it.
Plenty of other batteries provide frequency services to other grids, and a few of them are larger than Kapolei. But this is the only large-scale battery that we’ve seen capable of combining the basic peak capacity, frequency response, synthetic inertia and grid-rebooting tasks. That’s because Kapolei plays a more central role in its grid than battery plants do elsewhere.
After years of construction, California’s grid battery fleet surpassed 5,000 megawatts installed last year, but that only equates to 7.6% of the mammoth nameplate capacity of the state’s grid. Kapolei alone constitutes about 17% of Oahu’s peak capacity. Hawaiian Electric needed it to take on more responsibility than batteries elsewhere have ever had to.
Take inertia, which stabilizes grid frequency, as one example. Old plants provide this passively, through the spinning mass of their turbines; inertia didn’t need to be defined and compensated for separately in bygone decades because it was part of the package of running a power plant.
Now, across the country, the grid is moving to a model of maximizing cheap renewables when they are available and burning fuel when renewables aren’t. But the thermal plants need to be spinning to provide inertia — sometimes, on the mainland, renewables get curtailed to keep old coal plants running so they can deliver these grid services, Keefe said. This can be a bad deal for electricity customers, not to mention the climate.
Advanced batteries provide a synthetic version of this inertia through savvy programming of their inverters. This offers a more economic alternative while avoiding unnecessary carbon emissions. They also are faster and more precise — Keefe likened the Kapolei battery to a zippy electric sports car compared to the lumbering diesel bus of old thermal plants. That makes batteries a good technical fit for grids that are becoming increasingly volatile due to the fluctuations of renewable production.
Longer-term, U.S. climate goals require a phaseout of fossil fuels from the electric grid. Hydropower and nuclear plants help deliver valuable grid inertia without carbon emissions, but they aren’t on track to grow.
That’s why this project matters to the clean energy shift everywhere: It’s one of the first real-life examples of how to shift critical grid functions from fossil-fueled plants to clean energy plants. And eventually, the kind of grid services Kapolei has pioneered will have to scale nationwide.